> ## Documentation Index
> Fetch the complete documentation index at: https://wb-21fd5541-update-regex-mention.mintlify.site/llms.txt
> Use this file to discover all available pages before exploring further.
# View Eval Tables
When you create an Eval Table, specify which columns contain inputs, outputs, and scores. W\&B groups the columns into corresponding sections in the Eval Table.
The following example shows the basic structure of an EvalTable object:
```python theme={null}
import wandb
wandb.EvalTable(
input_columns=["column1", "column2"],
output_columns=["output_column1", "output_column2"],
score_columns=["score_column1", "score_column2"],
)
```
Pass one or more column names to each of the following arguments:
* `input_columns`: Data provided to the model, such as an image, prompt, or ground-truth label.
* `output_columns`: Values produced by the model, such as a prediction or generated response.
* `score_columns`: Metrics or other values used to evaluate the output.
W\&B displays these columns in the Inputs, Outputs, and Scores sections of the Eval Table.
The examples on this page use code from [Create an Eval Table](/models/evaltables/create-an-evaluation-table). Expand **View code** to view or copy the complete example.
```python theme={null}
import pandas as pd
import wandb
df = pd.DataFrame(
[
{
"image_id": "img_001",
"true_label": "cat",
"predicted_label": "cat",
"confidence": 0.97,
"correct": True,
},
{
"image_id": "img_002",
"true_label": "dog",
"predicted_label": "cat",
"confidence": 0.72,
"correct": False,
},
{
"image_id": "img_003",
"true_label": "car",
"predicted_label": "car",
"confidence": 0.89,
"correct": True,
},
]
)
df["correct"] = df["correct"].astype(object) # preserves native Python bools
with wandb.init(project="classifier-eval-table-demo") as run:
eval_table = wandb.EvalTable(
dataframe=df,
input_columns=["image_id", "true_label"],
output_columns=["predicted_label"],
score_columns=["correct", "confidence"],
)
run.log({"validation_predictions_eval": eval_table})
```
For example, consider the code example from [Create an Eval Table](/models/evaltables/create-an-evaluation-table):
```python theme={null}
import wandb
with wandb.init(project="classifier-eval-table-demo") as run:
eval_table = wandb.EvalTable(
dataframe=df,
input_columns=["image_id", "true_label"],
output_columns=["predicted_label"],
score_columns=["correct", "confidence"],
)
run.log({"validation_predictions_eval": eval_table})
```
In that example:
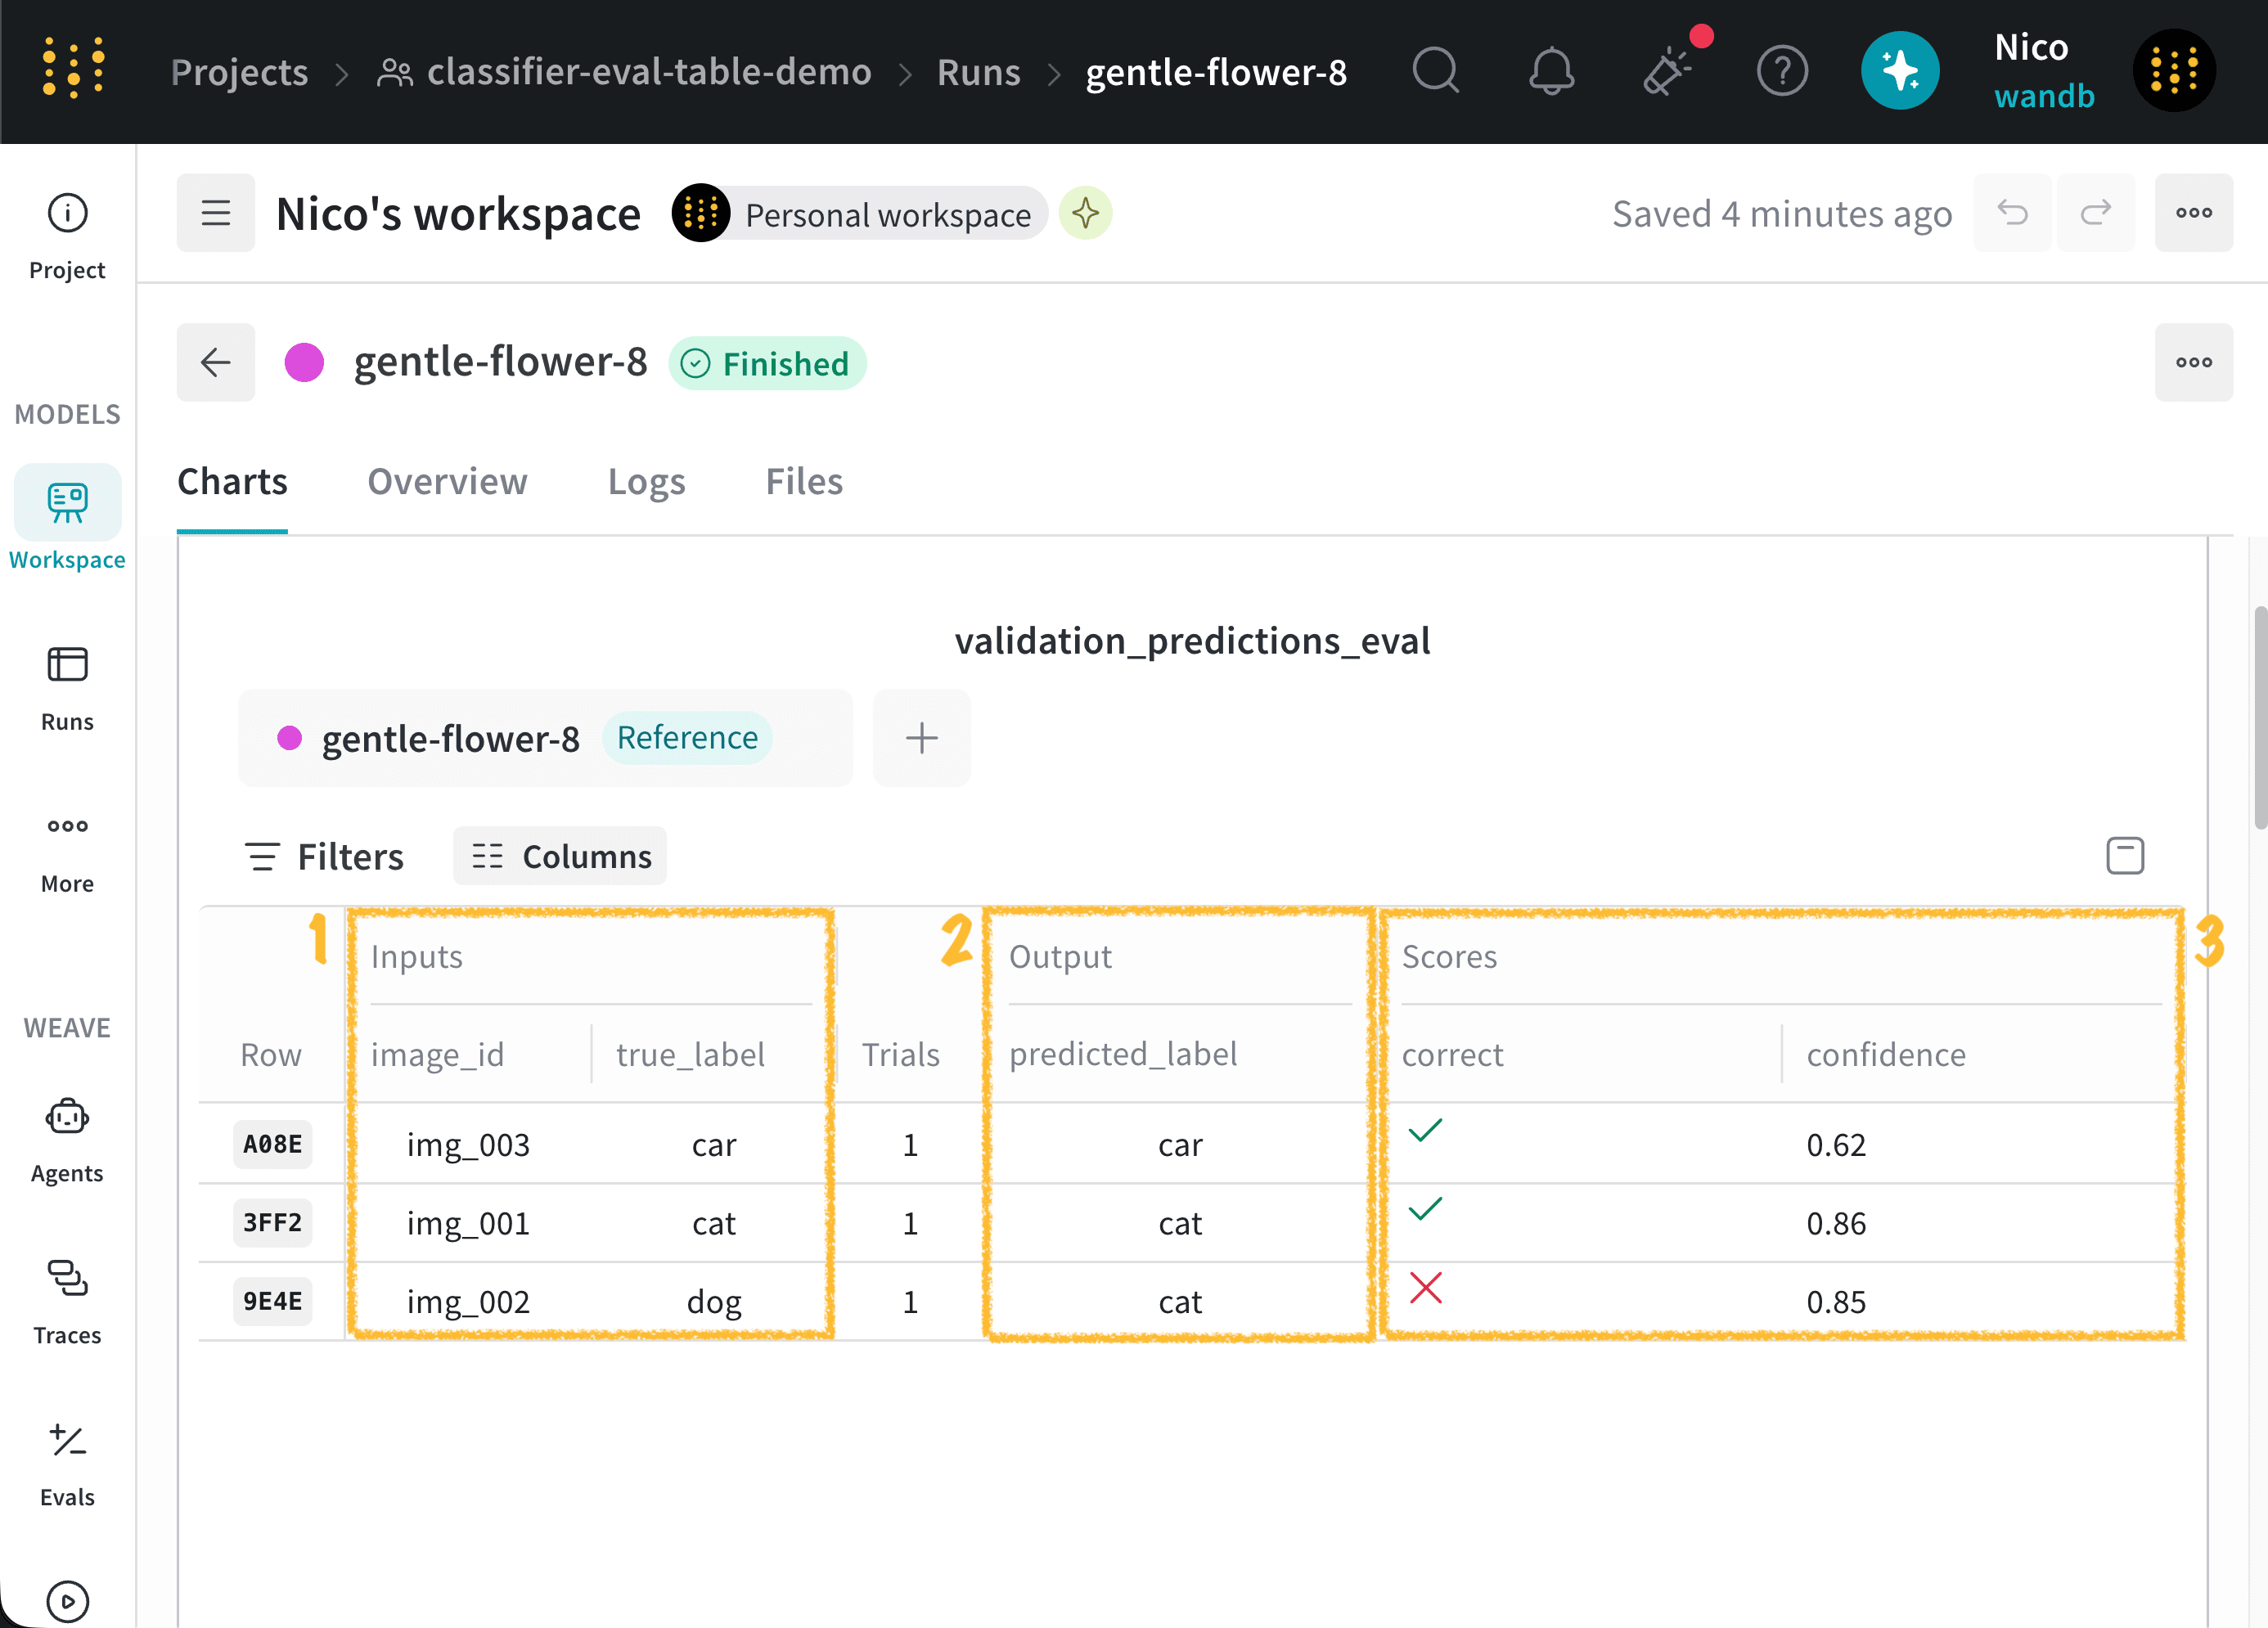
* The **Inputs** section contains the `image_id` and `true_label` columns.
* The **Outputs** section contains the `predicted_label` column.
* The **Scores** section contains the `correct` and `confidence` columns.
The following image highlights these sections:
 ## Detail view
Select a row to open a detailed view of that example. The detail view shows the example's inputs, outputs, and scores.
The following image shows the detail view for the first row in the Eval Table:
## Detail view
Select a row to open a detailed view of that example. The detail view shows the example's inputs, outputs, and scores.
The following image shows the detail view for the first row in the Eval Table:
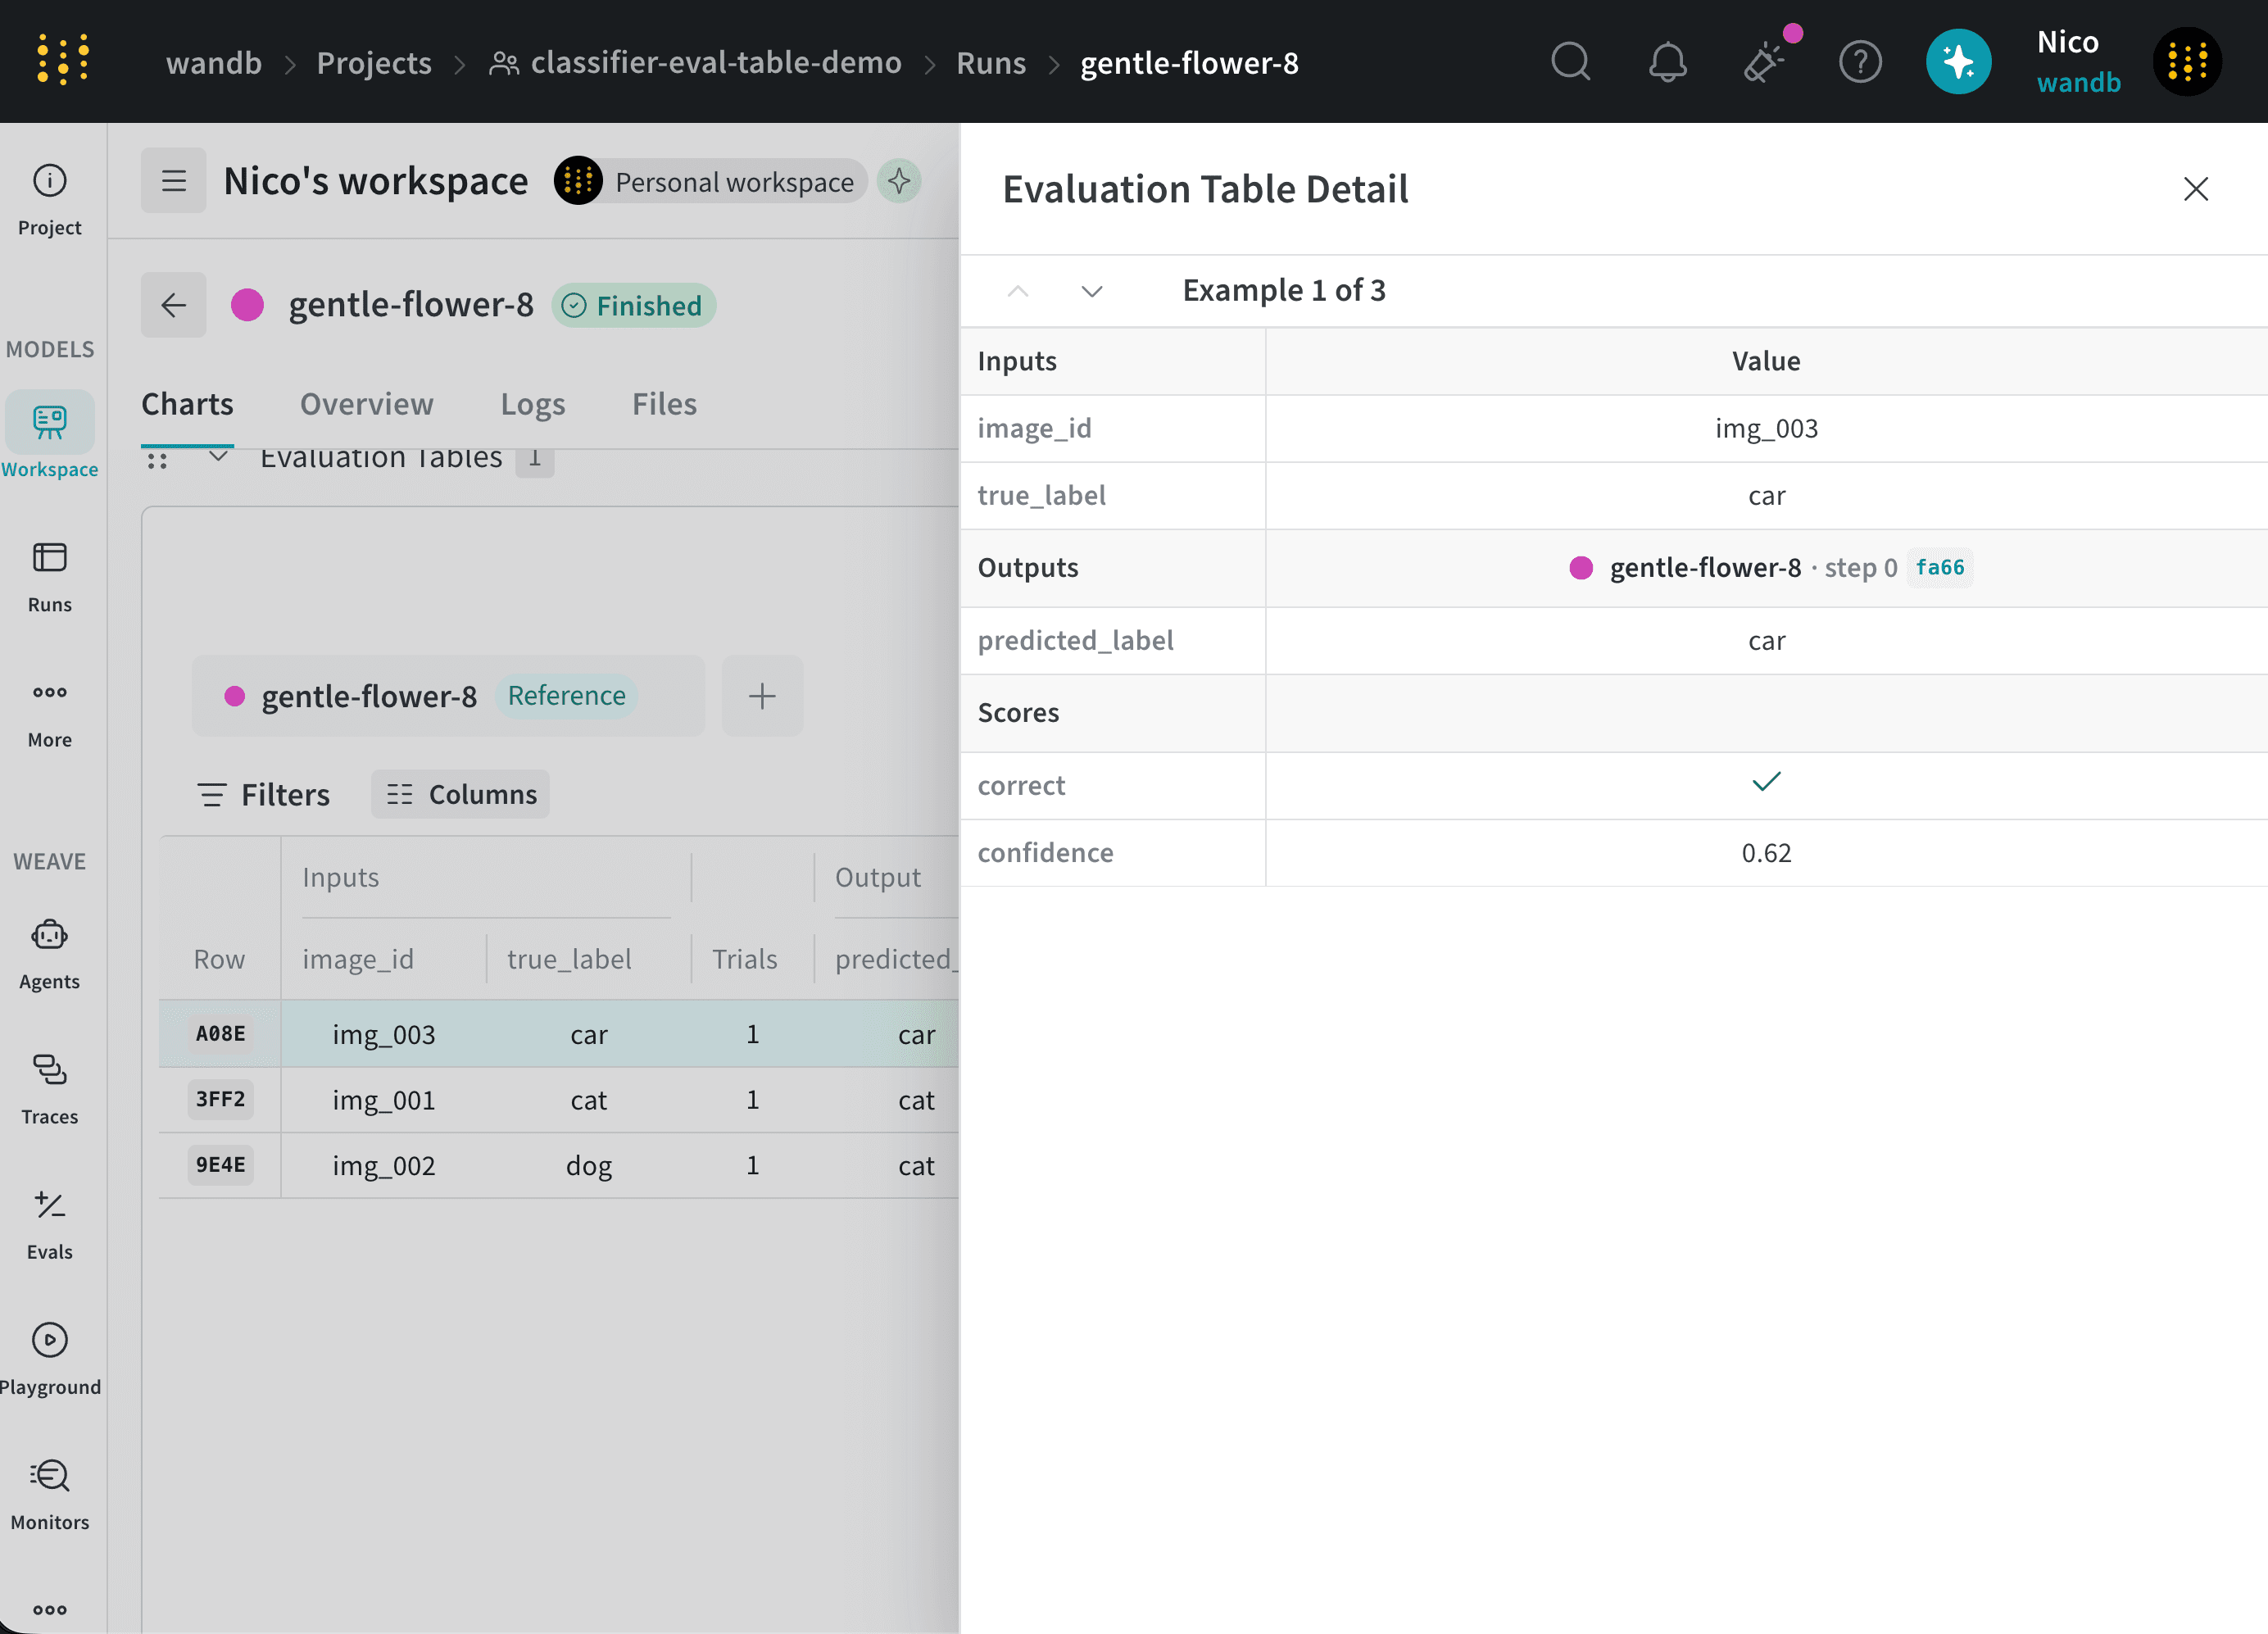 Use the detail view to inspect examples when the table contains many columns or when you compare results across multiple runs.
Select the up or down arrow above the **Inputs** section to move between examples in the current table view.
## Filter data
Use filters to display only rows that match specific conditions.
To add a filter:
1. Select the **Filter** button above the table.
2. From the dropdown, select the column to filter.
3. Select an operator.
4. Specify a value.
W\&B automatically applies the filter to the table and displays only rows that match the condition.
Use the detail view to inspect examples when the table contains many columns or when you compare results across multiple runs.
Select the up or down arrow above the **Inputs** section to move between examples in the current table view.
## Filter data
Use filters to display only rows that match specific conditions.
To add a filter:
1. Select the **Filter** button above the table.
2. From the dropdown, select the column to filter.
3. Select an operator.
4. Specify a value.
W\&B automatically applies the filter to the table and displays only rows that match the condition.
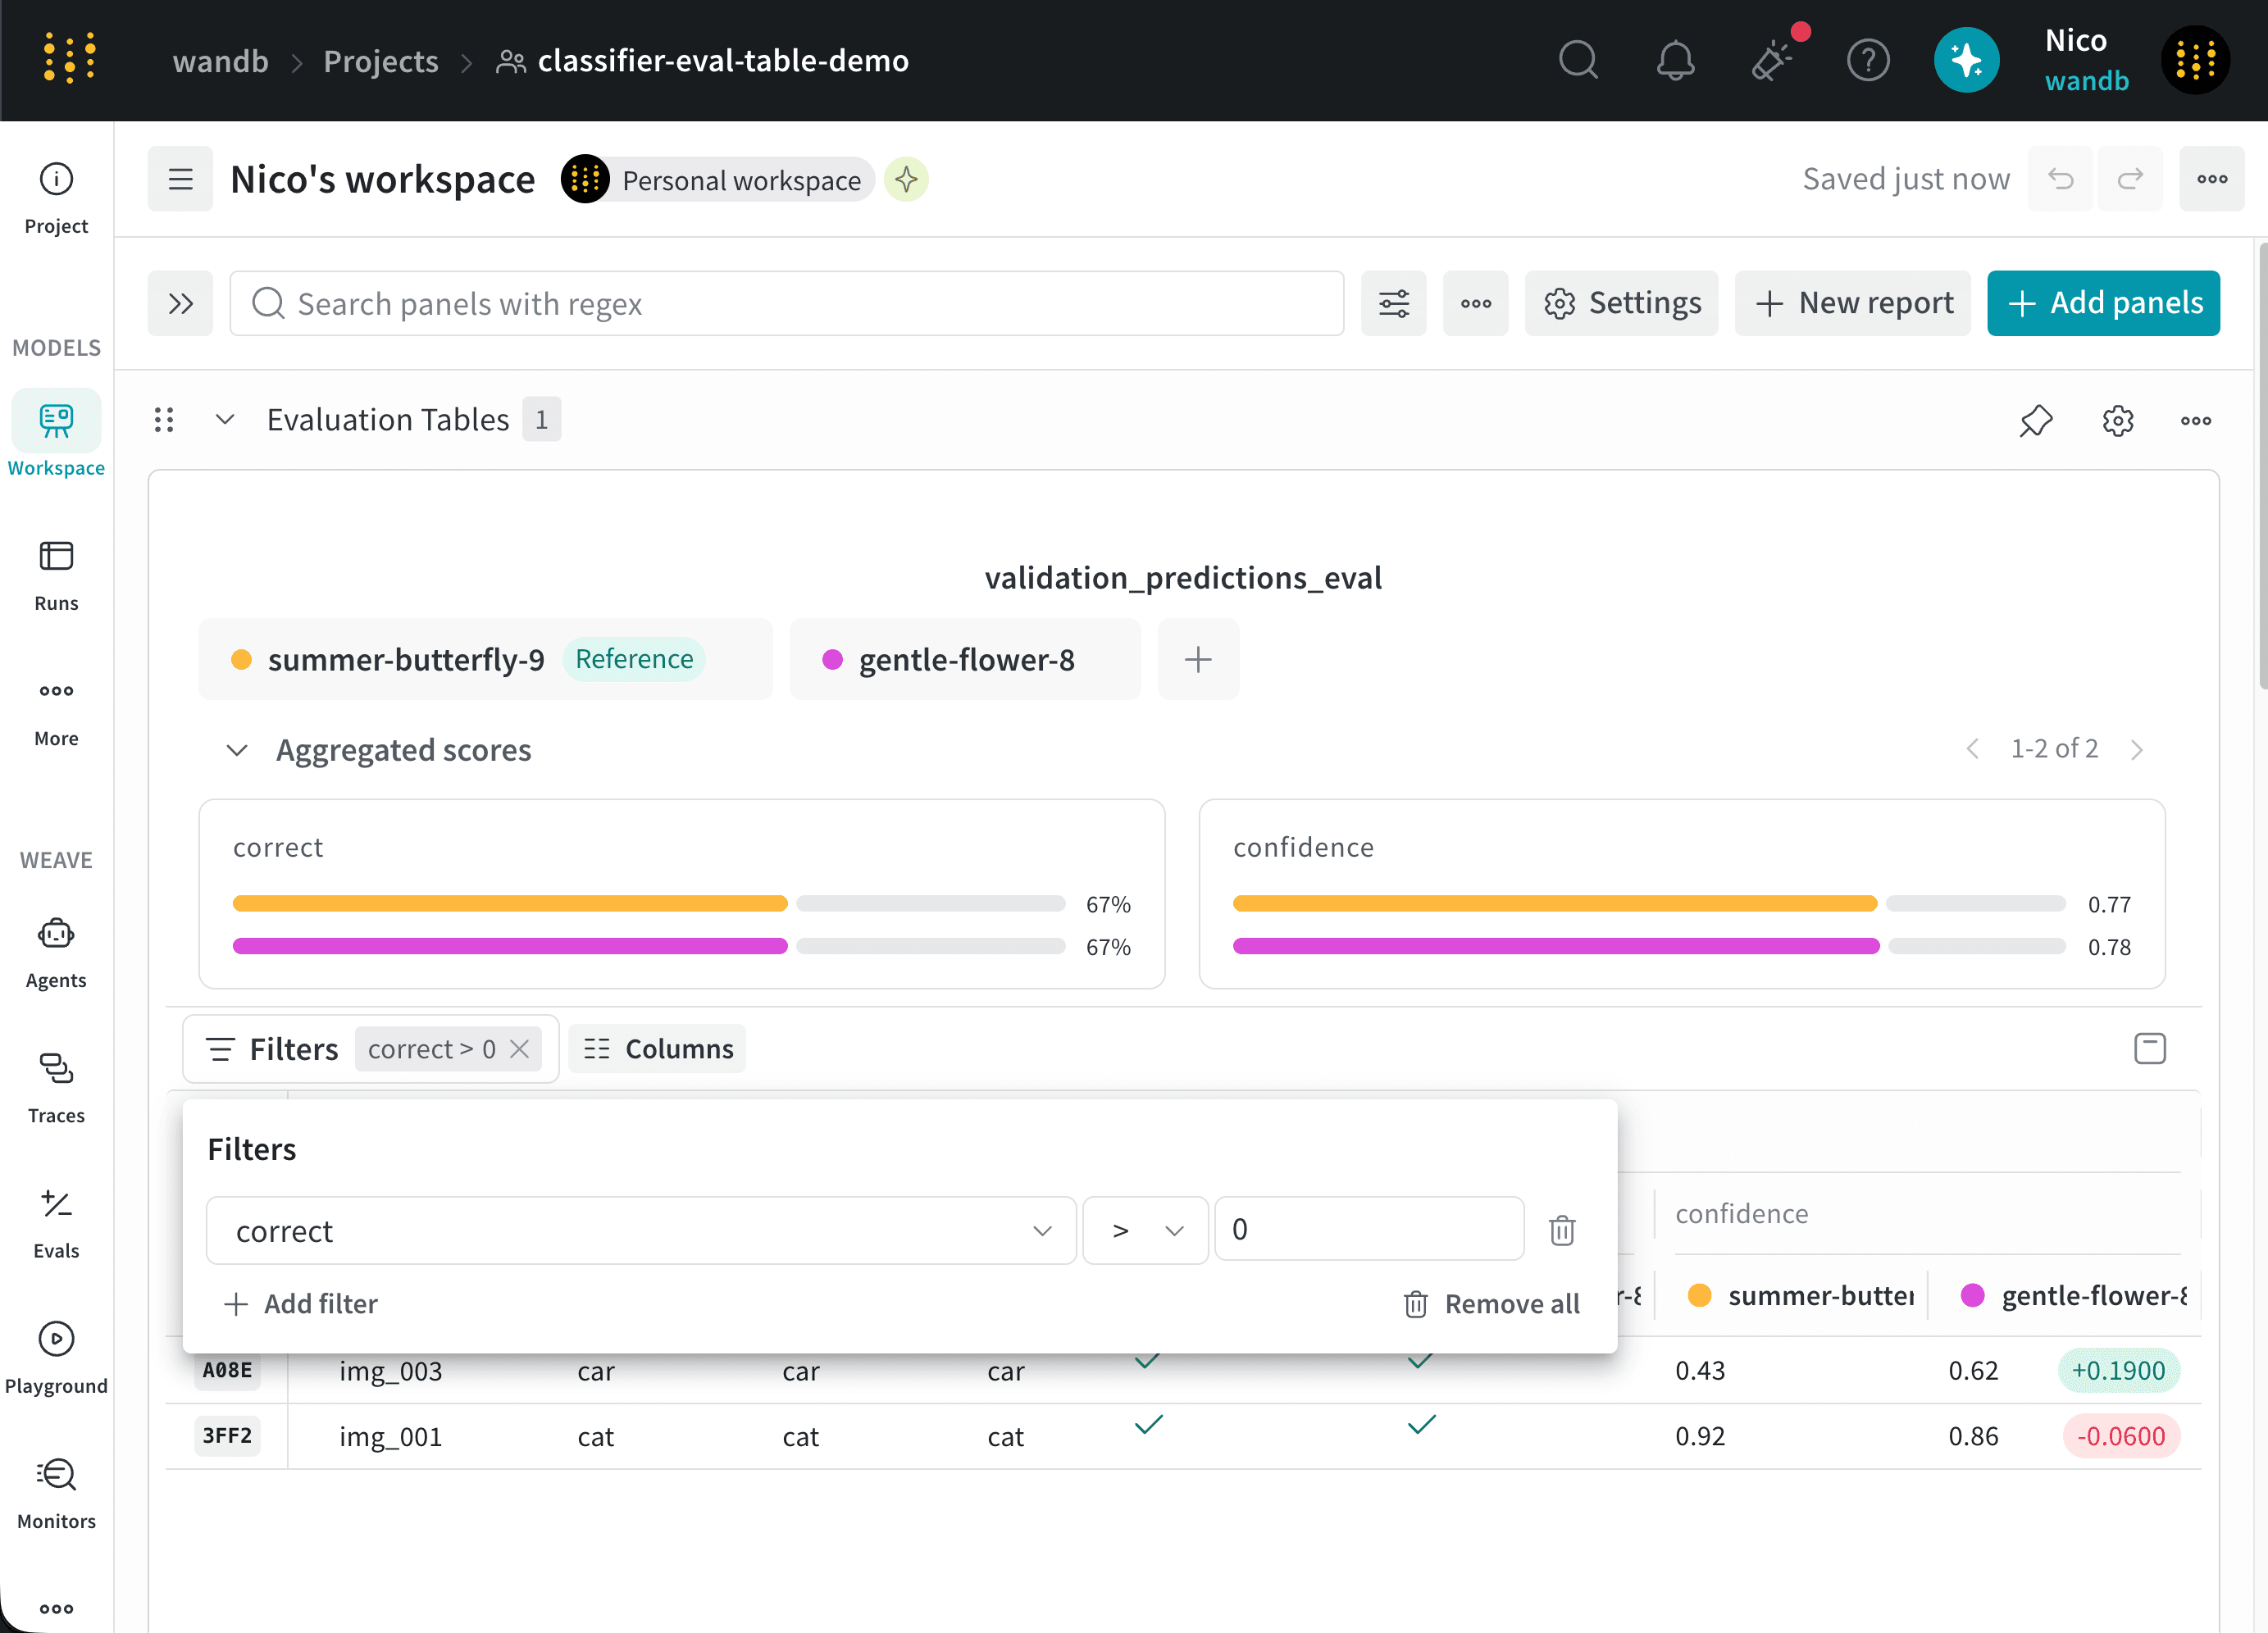 You can apply multiple filters. To remove a filter, select the `X` next to it.
## Show or hide columns
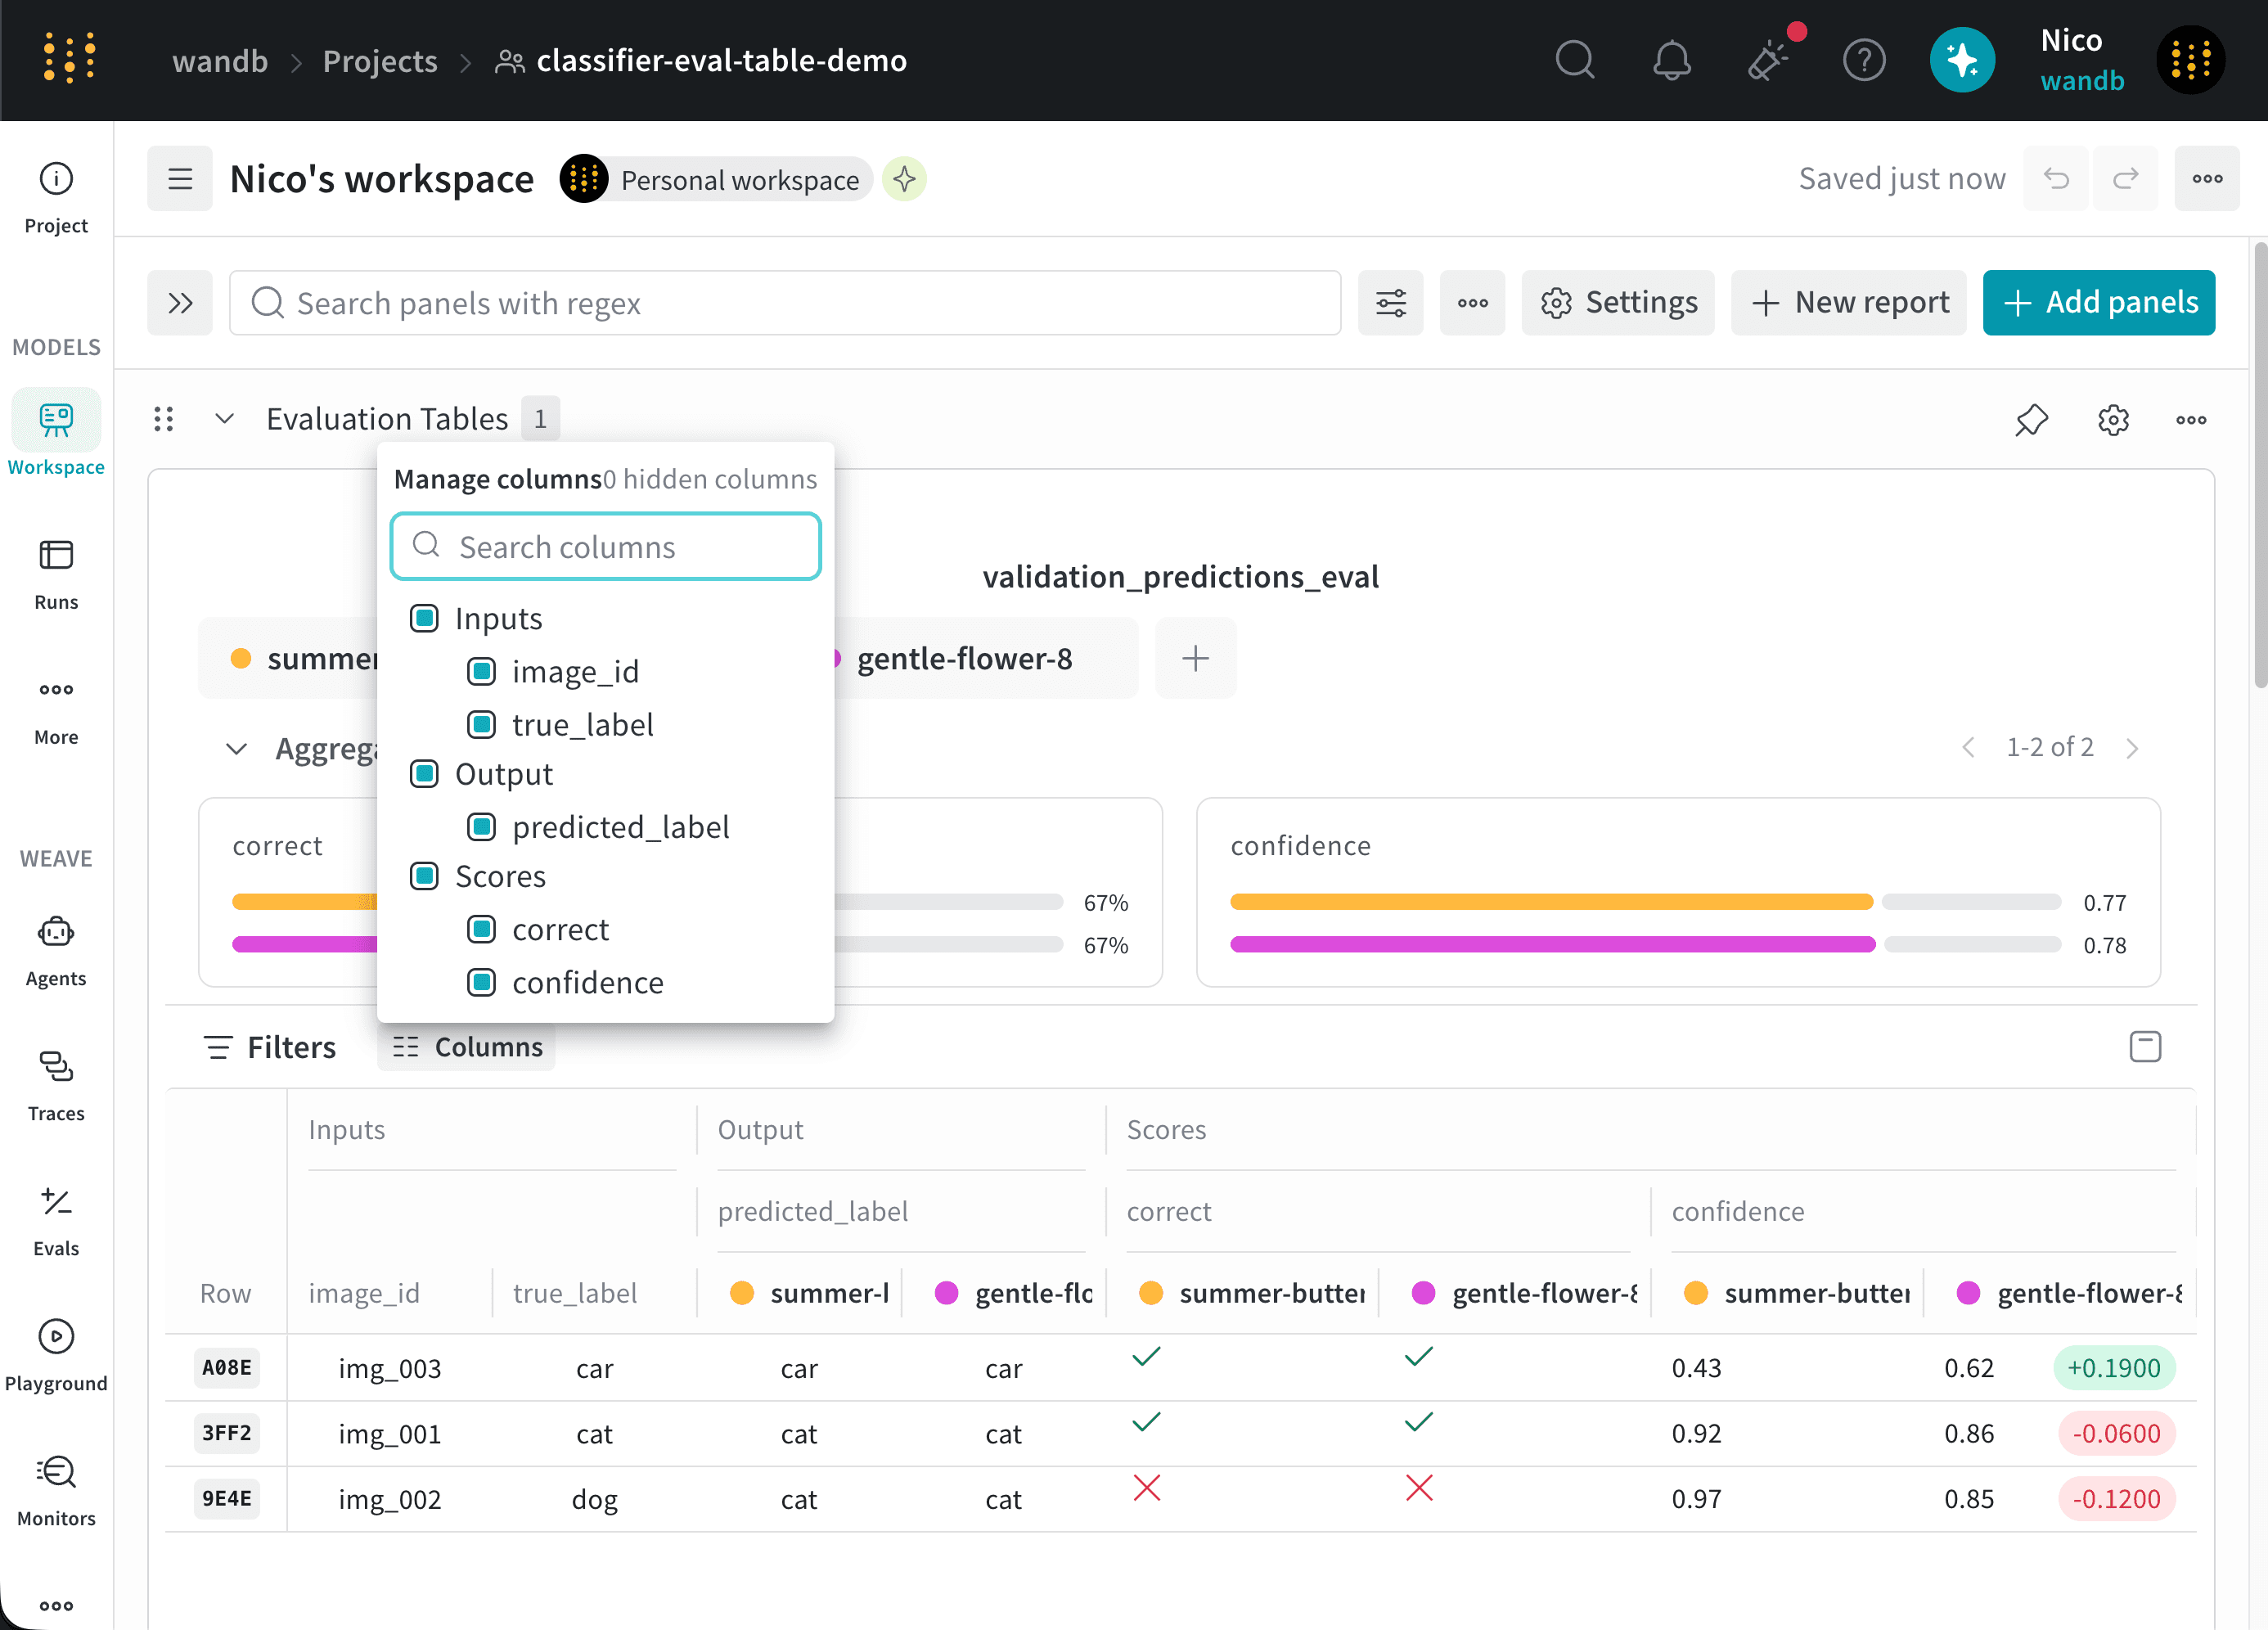
Use the **Columns** menu to control which columns appear in the Eval Table. The available columns depend on the data logged to the table.
To show or hide a column:
1. Select **Columns** above the table.
2. Select a column to show it, or clear the column to hide it.
The following image shows a Columns menu in which all available columns are selected:
You can apply multiple filters. To remove a filter, select the `X` next to it.
## Show or hide columns
Use the **Columns** menu to control which columns appear in the Eval Table. The available columns depend on the data logged to the table.
To show or hide a column:
1. Select **Columns** above the table.
2. Select a column to show it, or clear the column to hide it.
The following image shows a Columns menu in which all available columns are selected: